Gnuplot display on DomTerm
I have recently spent a lot of time on
DomTerm, which
is becoming a fairly decent terminal emulator.
Being based on HTML5 technologies lets you do many
interesting things, including embed graphics.
The new qtdomterm standalone terminal
emulator is especially nice;
alternatively, you can also use the domterm --browser
command to start a process that uses a window/tab in your default
desktop browser.
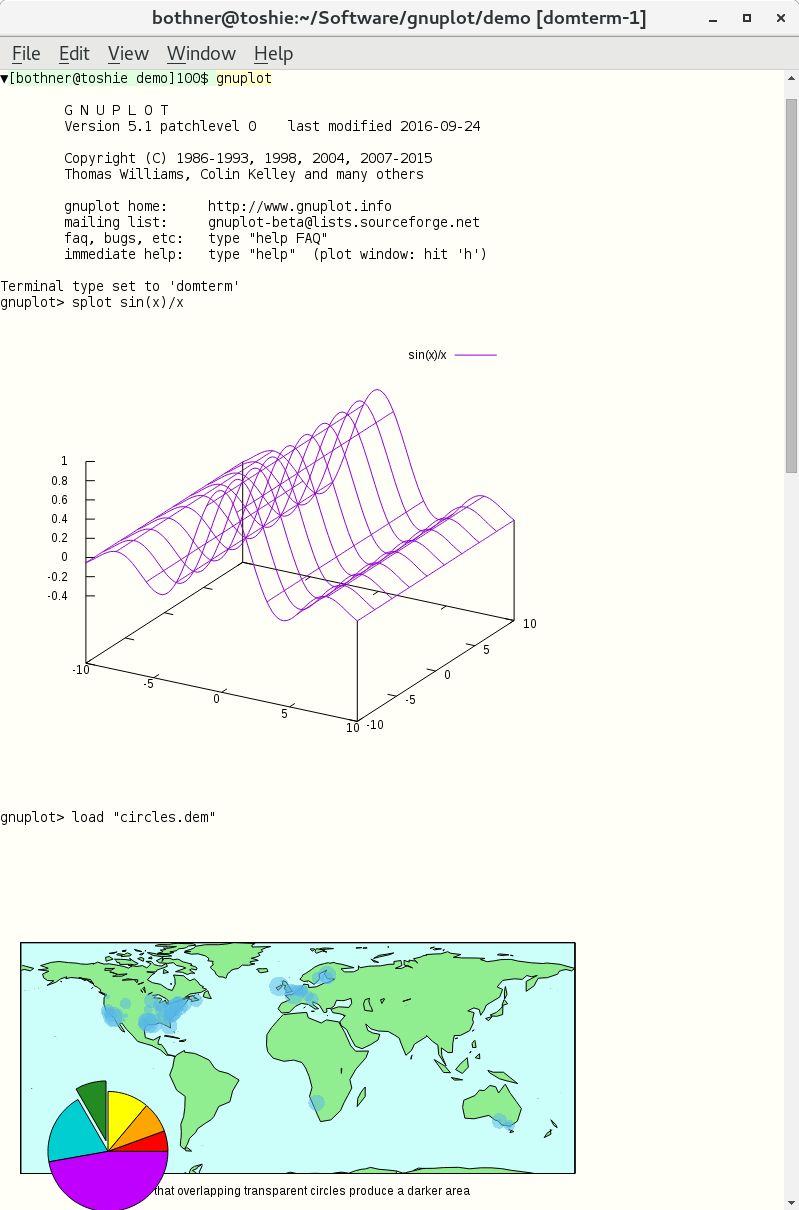
The gnuplot
package is a powerful graphing package.
It has a command-line that lets you specify complicated
functions and plots, and then give a plot command
to display the resulting plot. Unfortunately, it is difficult
to find a a good front-end that is usable for both command-line
interaction and graphics. People usually have to
specify output to either a file or an external viewer.
Would that one could insert the plots directly in the REPL output stream!
The development version of gnuplot (i.e. 5.1, available from CVS)
has native support for DomTerm.
It has domterm as a new terminal type, which you can select
explicitly (with the command set term domterm),
or use by default (since gnuplot
checks the DOMTERM environment variable,
which is set by DomTerm).
This works by using the pre-existing svg output driver
to generate SVG, but surrounding the SVG by escape sequences, and then printing
the result to standard output. DomTerm recognizes the escape sequence,
extracts the SVG (or more generally clean HTML) and inserts it
at the cursor
.
You can save the session output to an html file.
Here is an example.
In qtdomterm you can use the File / Save As menu item;
otherwise ctrl-shift-S should work.
This is a single html file, with embedded SVG;
images are embedded with a data: URL.
The file is actually XML (xhtml), to make it easier to process.
The saved file does need to css and js (JavaScript) files to be
readable, so you need to link or copy
the hlib directory in the DomTerm source distribution.